Healthcare
  Education
  Automotive
  Real Estate
  Fashion
  Logistic
  Fitness
  Tourism
  Travel
  Banking
  Media
Media  E-commerce
  Themes
 Plugins
 Patterns
How To Create A Data Model In Power BI
Power BI
Data modeling is the process of creating visual representations of the connections between data structures, with information about the individual attributes contained within those data structures. Power BI is a powerful business intelligence tool that allows users to transform raw data into visually appealing and interactive reports and dashboards. One of the key steps in building meaningful reports is creating a well-structured data model.
Data Modeling is one of the features used to connect multiple data sources in BI tool using a relationship. A relationship defines how data sources are connected with each other and you can create interesting data visualizations on multiple data sources.
Use of Power BI Data Model
Data Integration
Power BI data models enable users to connect to various data sources such as databases, spreadsheets, cloud services, and more. Users can bring together data from multiple sources into a single model, simplifying the process of data integration.
Data Transformation
Power BI provides a powerful set of data transformation and cleansing tools. With Power Query, users can clean, shape, and transform data before loading it into the data model. This ensures that the data is accurate and suitable for analysis.
Relationships
Data models allow users to define relationships between tables. These relationships are essential for combining data from different tables and creating meaningful insights. Power BI supports one-to-one, one-to-many, and many-to-many relationships.
Data Modeling
Power BI data models enable users to create calculated columns and measures. Calculated columns are used to create new columns based on expressions, while measures are used to perform calculations on the data. These calculations can be simple aggregations or complex business logic.

Power BI Dashboard
Data Hierarchies
Data models can include hierarchies that make it easier to drill down into data for detailed analysis. For example, you can create a time hierarchy with year, quarter, month, and day levels.
Data Security
Power BI provides options for data security. You can control who has access to specific data and limit what they can see. Row-level security allows you to restrict data based on user roles or attributes.
Performance Optimization
Power BI’s data model is designed for high performance. It uses a columnar storage engine and in-memory processing, which can significantly speed up data retrieval and calculations, especially for large datasets.
Data Refresh
Power BI allows users to schedule data refreshes to keep the data model up to date. This is essential for ensuring that reports and dashboards always reflect the latest data.
Data Exploration
Once the data model is created, users can use Power BI Desktop or the Power BI service to explore data, create interactive reports, and build insightful dashboards. Users can drag and drop fields onto visuals, create charts, tables, and maps, and interact with the data.
Sharing and Collaboration
Power BI data models can be shared with others in the organization or externally. Users can publish reports and dashboards to the Power BI service, share them with colleagues, and collaborate on data analysis projects.
To create a data model in Power BI, follow these steps:
- Open Power BI Desktop.
- Click Get Data.
- Select the data source you want to connect to and click Connect.
- Select the tables you want to import and click Load.
- Once the data is imported, you can start creating relationships between the tables. To do this, drag the primary key column from one table to the corresponding foreign key column in another table.
- You can also create calculated tables and measures. To create a calculated table, click the New Table button in the Modeling tab. To create a measure, click the New Measure button in the Modeling tab.
- Once you are satisfied with your data model, you can start creating reports.
The following image is an example data model. The boxes contain tables of data, where each line item within the box is a column. The lines that connect the boxes represent relationships between the tables. These relationships can be complex, even in such a simplistic model. The data model can become easily disorganized, and the total table count in the model can gradually increase. Keeping your data model simple, comprehensive, and accurate requires constant effort.
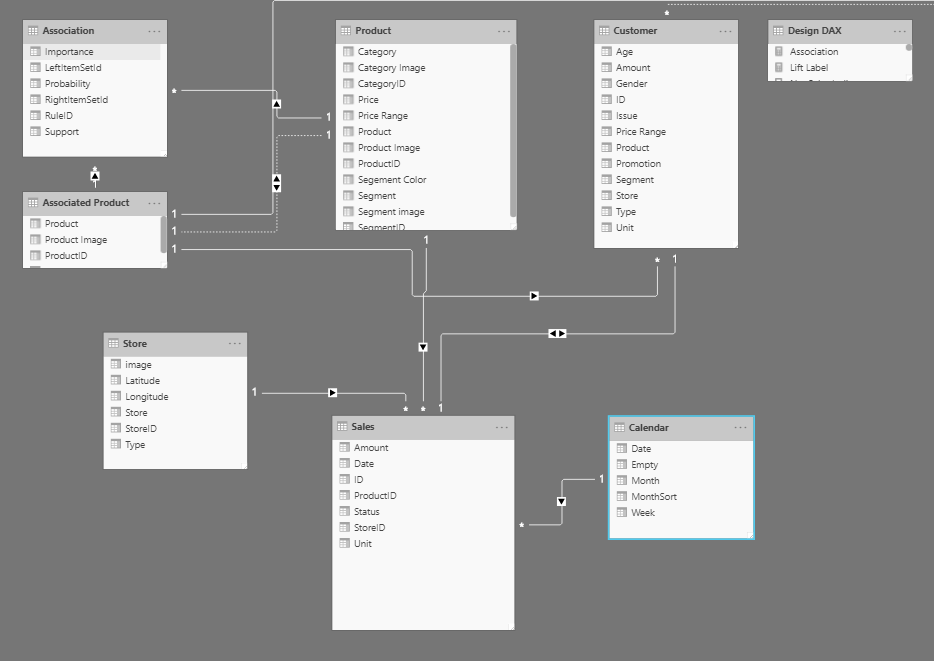
Power BI Data Model
Creating Relationships Between Tables
Relationships between tables are essential for creating a well-designed data model. Relationships allow you to connect related data from different tables. For example, you could create a relationship between a customer table and an order table. This would allow you to see all of the orders that a particular customer has placed.
To create a relationship between two tables, drag the primary key column from one table to the corresponding foreign key column in the other table. Power BI will automatically detect the relationship type.
Creating Calculated Tables
Calculated tables are a powerful way to extend your data model. They allow you to create new tables based on existing tables. For example, you could create a calculated table to calculate the total sales for each customer.
To create a calculated table, click the New Table button in the Modeling tab. Then, enter a name for the new table and a DAX expression to define the table.
Creating Measures
Measures are used to calculate and analyze your data. They can be used to create simple calculations, such as average sales, or more complex calculations, such as profit margin.
To create a measure, click the New Measure button in the Modeling tab. Then, enter a name for the measure and a DAX expression to define the measure.
Data Source: Begin by importing your data into Power BI. You can do this by selecting the appropriate data source from the “Home” tab.
Data Cleansing: Cleanse your data by removing duplicates, handling missing values, and correcting any inconsistencies. Power Query, a built-in data transformation tool, can help with this process.
Data Transformation: Transform your data as needed by applying various operations like filtering, sorting, pivoting, and merging tables using Power Query.
Testing Your Data Model
Once you have created your data model, it is important to test it to make sure that it is working correctly. You can do this by creating some sample reports and checking the results.To test your data model, click the Report tab. Then, drag some fields from the Fields pane onto the canvas. Power BI will automatically create a visualization based on the fields you have selected.
If you are not satisfied with the results, you can adjust your data model or the visualization settings.
Here Are Some Additional Tips for Creating a Data Model in Power BI
- Use a star schema design. A star schema is a type of data model that is optimized for analytics. It consists of a fact table and one or more dimension tables. The fact table contains the numeric data that you want to analyze, such as sales or revenue. The dimension tables contain descriptive data about the fact table, such as customer, product, and date.
- Use data types correctly. Power BI supports a variety of data types, such as text, numbers, dates, and times. It is important to use the correct data type for each column in your data model. This will help to ensure that your data is analyzed correctly.
- Manage granularity. Granularity refers to the level of detail in your data. For example, daily sales data has a higher granularity than monthly sales data. It is important to choose the right granularity for your data model. This will affect the performance and usability of your reports.
- Test your data model. Once you have created your data model, it is important to test it to make sure that it is working correctly. You can do this by creating some sample reports and checking the results.
Conclusion
Power BI is a stout and scalable business analytics tool that brings data closer to consumers. To maximize the value from adopting it, create data models, based on the selected use cases and available data times. Remember: complexity will often mean tradeoffs in performance.
Creating a data model in Power BI is an essential step to harness the full potential of its data assets. By integrating, transforming, and modeling data effectively, our Power BI Expert can unlock valuable insights, drive informed decision-making, and gain a competitive edge in the ever-evolving business landscape. With Power BI’s versatile features for data integration, modeling, and visualization, IT Path Solutions can empower its teams to explore data, collaborate on analysis, and ultimately transform raw information into actionable intelligence.