

Top Power BI Dashboard Reports That Can be Used for Major Industry Verticals

Keyur Patel
September 12, 2025
6 min
Last Modified:
October 13, 2025
Introduction
Data plays a pivotal role in the functioning of any business. However, the true value lies not just in the data itself, but in the insights and actions derived from it. This is where a Microsoft Power BI Dashboard proves its worth. Power BI consultants are often hired by businesses to develop custom Power BI solutions.
While data is undoubtedly crucial, it’s the interpretation and utilisation of that data that can either define the success or failure of a business. Microsoft Power BI Dashboards step into the spotlight here, enabling businesses to transform raw data into meaningful insights.
In essence, it’s the ability to extract actionable insights from data and leverage them to make informed decisions that can propel a business forward. This is where the prowess of a Microsoft Power BI Dashboard shines, providing a powerful platform to visualise, analyse, and draw conclusions from data in a way that informs strategic choices and drives growth.
Retail Industry
In the retail industry, Power BI dashboards offer a range of essential tools. These tools empower businesses to compare store performance, predict demand, and optimise inventory levels. By visualising data on sales trends, stock availability, and customer preferences, retailers can make informed decisions that enhance efficiency, target marketing efforts, and ultimately improve the overall shopping experience & data analyzation. The tools include:
- Sales Performance Analysis
- Inventory Management
- Customer Segmentation and Analysis
- Store Performance Comparison
- Demand Forecasting
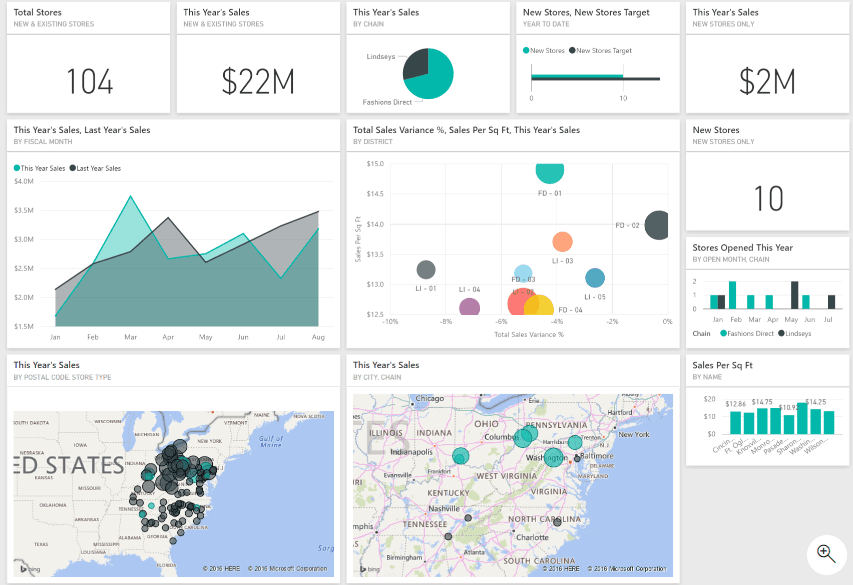 Fig 1. – Uses of PowerBI in Retail Industry
Healthcare Industry
In the healthcare sector, Power BI dashboards provide essential tools for tracking patient admission and discharge trends, monitoring operational efficiency, assessing medical staff productivity, tracking disease outbreaks, and analyzing patient satisfaction. By visualizing these aspects, healthcare providers can enhance resource allocation, effectively respond to outbreaks, and improve patient care. Power BI empowers informed decision-making, optimizes processes, patient health revuports and ensures quality healthcare delivery. The tools include:
- Patient Admission and Discharge Trends
- Operational Efficiency Tracking
- Medical Staff Productivity
- Disease Outbreak Monitoring
- Patient Satisfaction Analysis
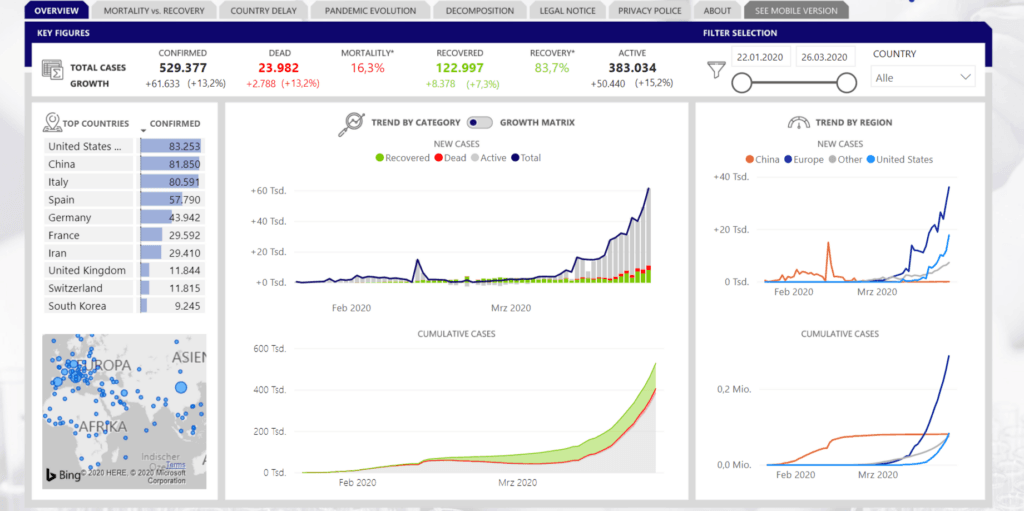 Fig 2. – Uses of PowerBI in Healthcare Industry
Finance Industry
In the finance industry, Power BI financial dashboards facilitate essential functions, including financial statement analysis, risk assessment analysis and management, investment portfolio performance tracking, budget versus actual analysis & tracking, and evaluation of customer financial health profiles. These tools enable financial professionals to gain insights, make informed decisions, and optimise strategies, thereby enhancing financial performance and client satisfaction.
Tools:
- Financial Statement Analysis
- Risk Assessment and Management
- Investment Portfolio Performance
- Budget vs. Actual Analysis
- Customer Financial Health Profiles
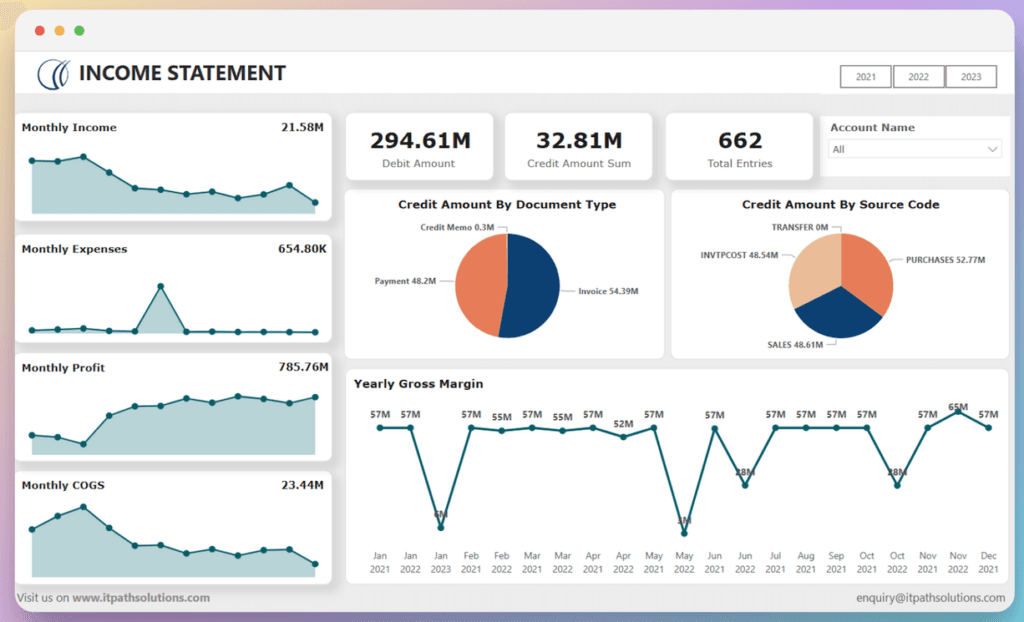 Fig 3. – Uses of PowerBI in Finance Industry
Manufacturing Industry
In the manufacturing sector, Power BI dashboards play a crucial role by monitoring production line efficiency, analysing quality control metrics, visualising supply chain dynamics, tracking equipment maintenance, and conducting defect analysis. These tools empower manufacturers to make data-driven decisions, optimise processes, and enhance overall operational effectiveness.
Tools:
- Production Line Efficiency
- Quality Control Metrics
- Supply Chain Visualization
- Equipment Maintenance Tracking
- Defect Analysis
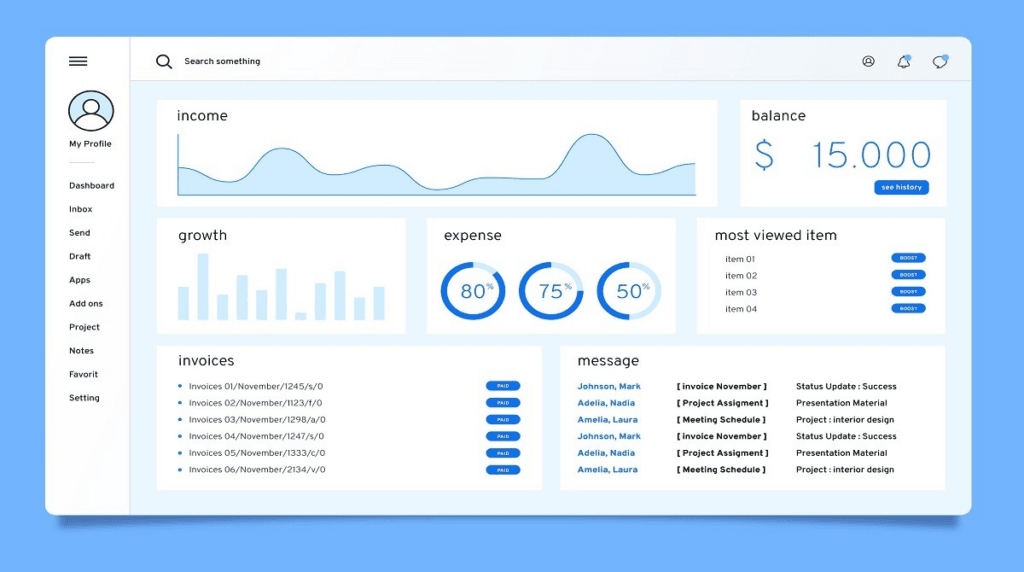 Fig 4. – Uses of PowerBI in Manufacturing Industry
Marketing and Advertising
In marketing and advertising, Power BI dashboards serve vital functions such as tracking campaign performance, analysing customer engagement, measuring social media reach and impact, assessing ROI on marketing channels, and conducting market segmentation. These tools empower marketers to derive insights, optimise strategies, and enhance overall campaign effectiveness.
Tools:
- Campaign Performance Tracking
- Customer Engagement Analysis
- Social Media Reach and Impact
- ROI on Marketing Channels
- Market Segmentation
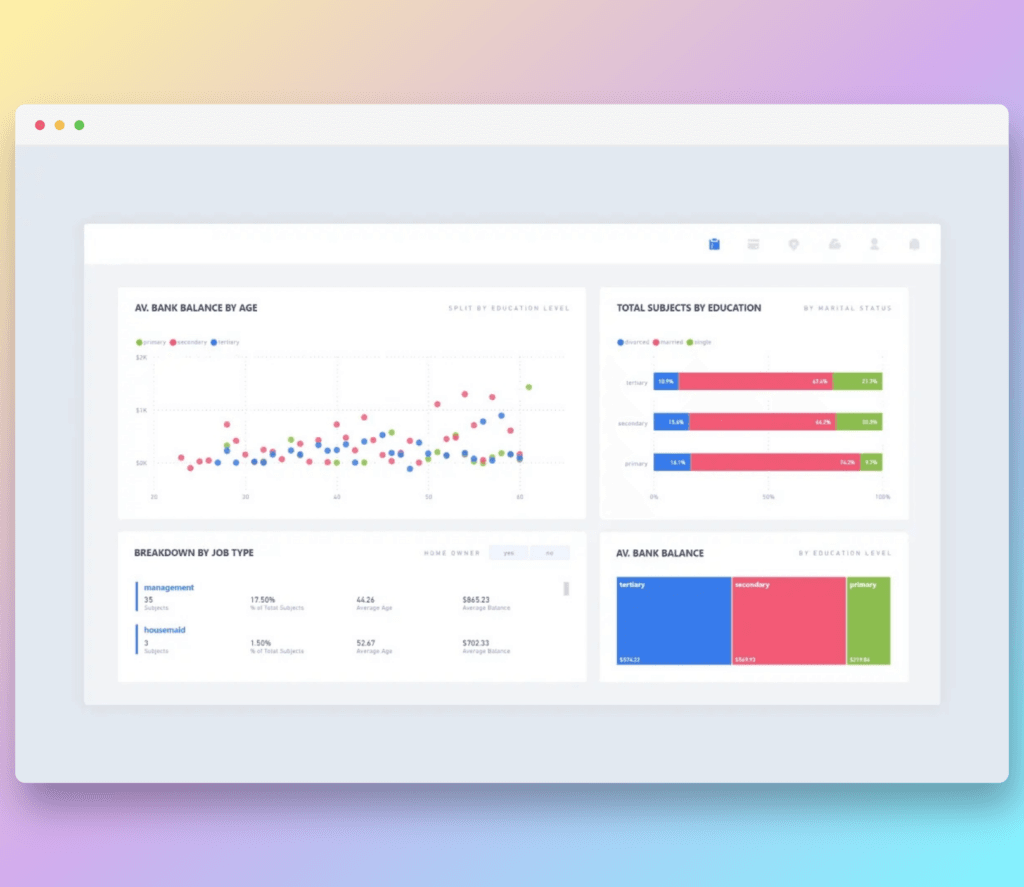 Fig 5. – Uses of PowerBI in Marketing Industry
Technology and IT
In the realm of technology and IT, Power BI dashboards play a pivotal role in tasks like tracking IT incidents, monitoring server performance, analysing user activity and access logs, reporting SLA compliance, and providing insights into software usage analytics. These tools enable IT professionals to enhance troubleshooting, optimise system performance, ensure security compliance, and make informed decisions for efficient software management.
Tools:
- IT Incident Tracking
- Server Performance Monitoring
- User Activity and Access Logs
- SLA Compliance Reporting
- Software Usage Analytics
 Fig 6. – Uses of PowerBI in IT Industry
Education Sector
Within the education sector, Power BI dashboards fulfil crucial roles, including student performance analysis, monitoring enrollment and retention trends, distributing faculty workload, measuring learning management system metrics, and comparing exam results. These tools empower educational institutions to make data-driven decisions, enhance teaching strategies, optimise resource allocation, and improve overall educational quality.
Tools:
- Student Performance Analysis
- Enrollment and Retention Trends
- Faculty Workload Distribution
- Learning Management System Metrics
- Comparative Exam Results
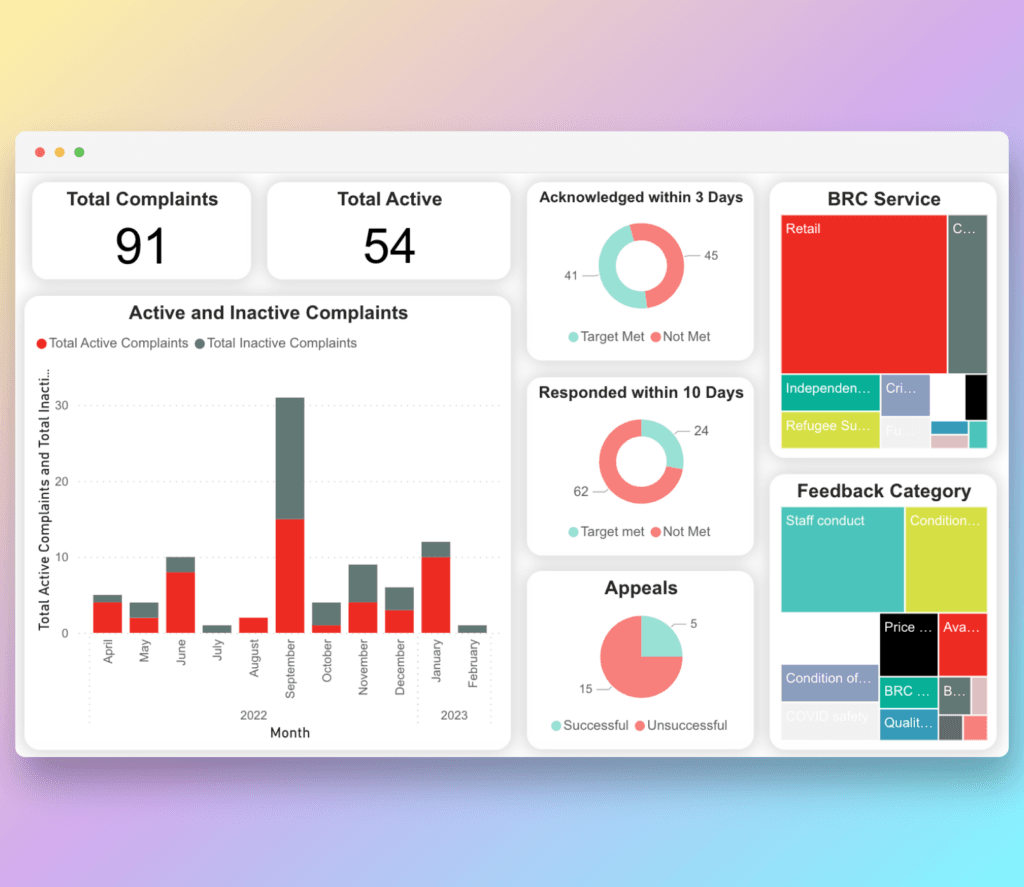 Fig 7. – Uses of PowerBI in Education Sector
Hospitality and Tourism
In the hospitality and tourism sector, Power BI dashboards serve essential functions like tracking room occupancy and revenue, evaluating guest satisfaction ratings, identifying popular travel destinations, analysing booking patterns and trends, and conducting seasonal demand analysis. These tools empower businesses in the industry to make informed decisions, enhance guest experiences, optimise marketing efforts, and manage resources effectively.
Tools:
- Room Occupancy and Revenue
- Guest Satisfaction Ratings
- Popular Travel Destinations
- Booking Patterns and Trends
- Seasonal Demand Analysis
 Fig 8. – Uses of PowerBI in Healthcare Sector
Energy and Utilities
In the energy and utilities sector, Power BI dashboards play a critical role by tracking energy consumption patterns, evaluating metrics for renewable energy production, monitoring equipment and maintenance, conducting cost analysis for utilities, and ensuring regulatory compliance. These tools empower organisations to optimise resource utilisation, improve sustainability efforts, enhance operational efficiency, and meet industry standards effectively.
Tools:
- Energy Consumption Patterns
- Renewable Energy Production Metrics
- Equipment Monitoring and Maintenance
- Cost Analysis for Utilities
- Regulatory Compliance Tracking
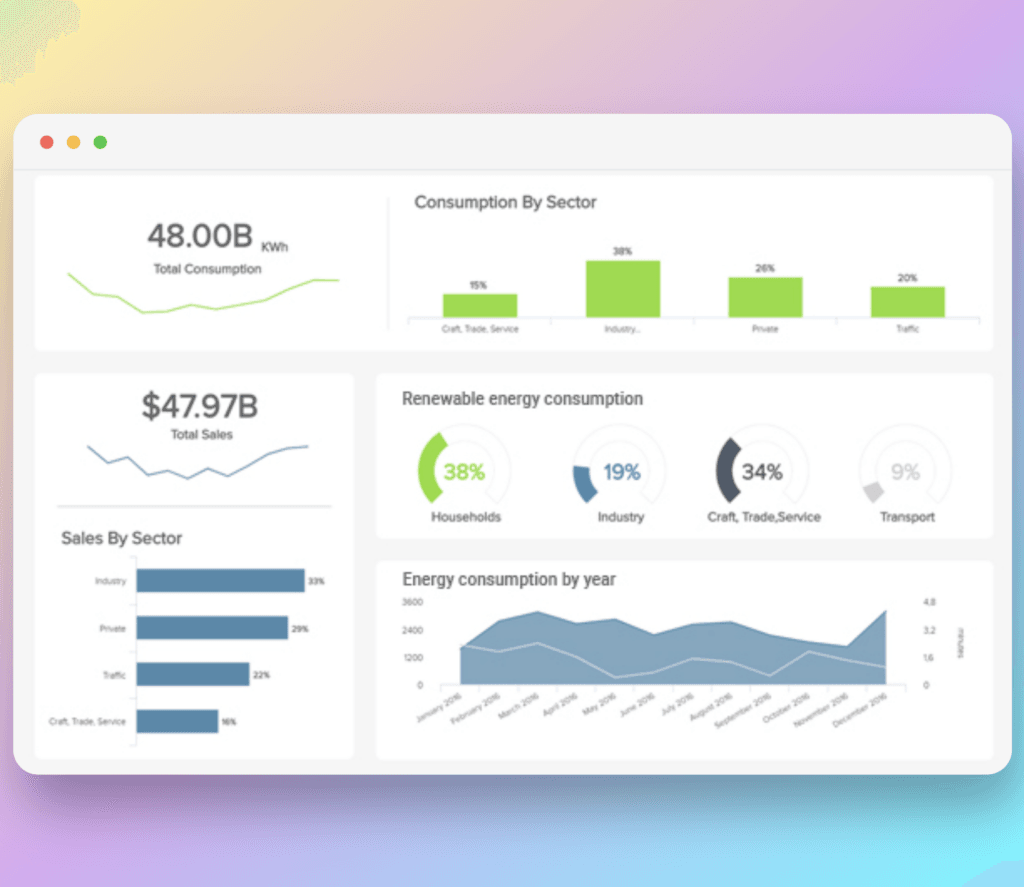 Fig 9. – Uses of PowerBI in Energy & Utilities Sector
Transportation and Logistics
In the realm of transportation and logistics, Power BI dashboards fulfill crucial roles including route optimization and efficiency, assessing fleet performance and utilization, analyzing delivery timeliness, managing warehouse inventory, and conducting freight cost analysis. These tools empower businesses to make informed decisions, enhance operational effectiveness, streamline supply chain processes, and manage resources efficiently.
Tools:
- Route Optimization and Efficiency
- Fleet Performance and Utilization
- Delivery Timeliness Analysis
- Warehouse Inventory Management
- Freight Cost Analysis
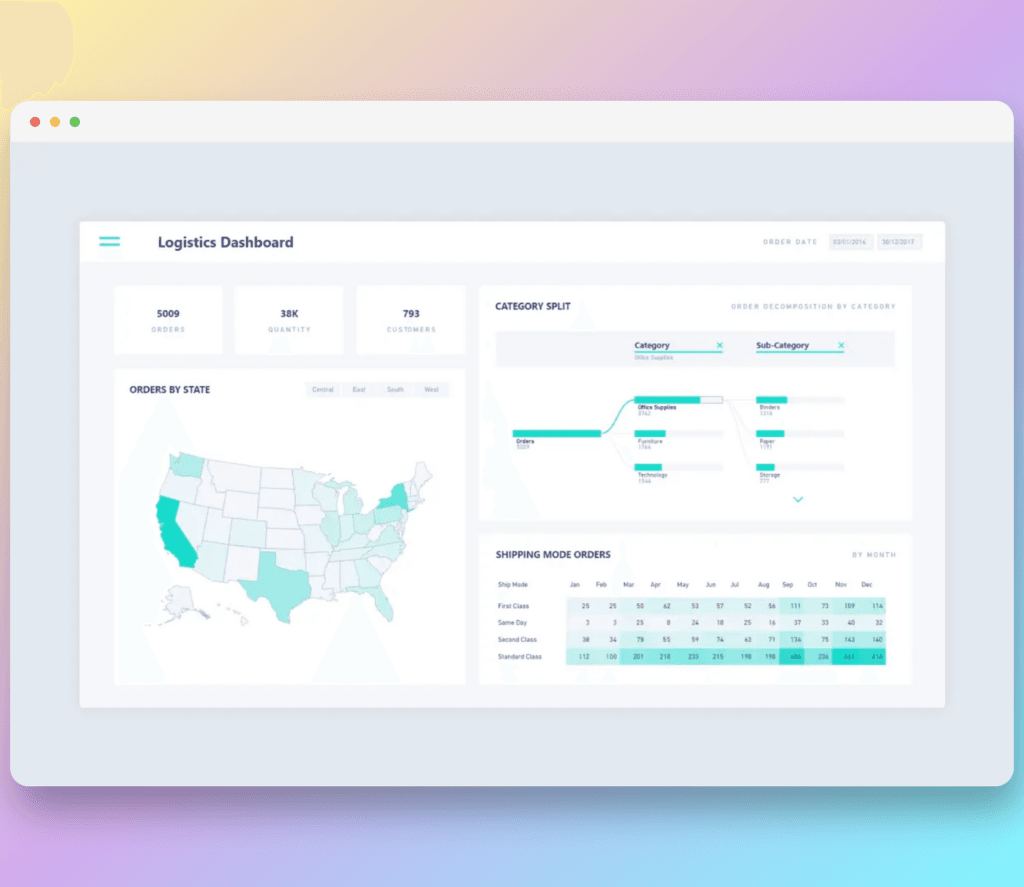 Fig 10. – Uses of PowerBI in Logistics Industry
Conclusion
In conclusion, the top Power BI dashboard reports curated for major industry verticals are transformative tools that catalyze growth, refine operations, and enhance competitiveness. As businesses evolve, these dashboards will continue to play a pivotal role in steering industries toward a future where insights are leveraged to their fullest potential.

Keyur Patel
Co-Founder
Keyur Patel is the director at IT Path Solutions, where he helps businesses develop scalable applications. With his extensive experience and visionary approach, he leads the team to create futuristic solutions. Keyur Patel has exceptional leadership skills and technical expertise in Node.js, .Net, React.js, AI/ML, and PHP frameworks. His dedication to driving digital transformation makes him an invaluable asset to the company.
Related Blog Posts

What Is Minimal Viable Product Development?

Mobile Business Intelligence: Comprehensive Guide & Key Insights