Home
»Blog Insights
»AI Agent Error Triage: How to Automatically Classify, Diagnose, and Route AI Failures
AI Agent Error Triage: How to Automatically Classify, Diagnose, and Route AI Failures
Keyur Patel
July 30, 2026
20 min
Last Modified:
August 19, 2026
It’s 2am and your phone buzzes with a stack trace that means nothing at a glance. Somewhere in your LLM agent pipeline, something broke, and now you have to work out whether it’s a failed tool call, a context window that filled up, or the agent stuck retrying the same broken step. That’s what running AI agents in production without a real triage layer feels like, and it’s exactly the gap proper AI agent monitoring is supposed to close.
Most teams running LangChain, CrewAI, AutoGen, or a custom agent stack handle this the same way. An engineer opens Sentry, scrolls through a raw trace, and manually decides what category of failure they’re looking at. That’s fine for the first ten errors. It stops working once agents ship real traffic and alerts pile up faster than anyone can read them.
This post walks through an n8n workflow built to fix that. It reads a raw agent error, classifies it against five real failure categories, attaches a fix playbook, and posts a severity-scored report to Slack, without pretending to have an answer when it doesn’t.
Is This AI Agent Monitoring Workflow Right for Your Team?
Not every team needs automated AI agent monitoring from day one. But once LLM-powered applications start handling real users and production workloads, manually reviewing every failure quickly becomes unsustainable. This workflow is designed for teams that want faster incident response, less repetitive debugging, and clearer visibility into recurring AI agent failures without adding another enterprise monitoring platform.
Who This Workflow Is For
This workflow is built for teams already running LLM agents in some form of production, whether that’s LangChain, CrewAI, AutoGen, or something built in-house, and already using Sentry and Slack.
You don’t need deep expertise in structured LLM outputs, just comfort with webhooks, basic APIs, and n8n’s visual editor. It’s aimed at the platform engineer or DevOps lead who owns “why did the agent break” questions by default, which is where AI agent monitoring starts for a team not ready to buy an enterprise platform yet.
When This Workflow Becomes Useful
There’s a point where manual triage stops being a minor annoyance and starts costing real time: the same handful of failure types keep appearing under different traces, each re-diagnosed from scratch because nothing tracks what’s already been seen.
Another sign is Slack alert fatigue, when errors flood a channel faster than anyone can read them and engineers start muting notifications just to get through the day. Once either happens, reading raw traces one by one stops making sense.
Stop Investigating the Same AI Agent Errors Over and Over
Get a ready-to-import n8n workflow that classifies AI agent failures, removes duplicate alerts, and delivers structured triage reports to Slack, so your team can spend less time debugging and more time fixing issues.
Get the Free WorkflowThe Challenges of Monitoring AI Agent Failures in Production
As AI agents move from experiments to production systems, failures become more frequent and more difficult to investigate. What starts as an occasional debugging task can quickly turn into hours of repetitive manual work. Without a reliable way to identify recurring failure patterns and prioritize critical incidents, engineering teams spend more time reacting to alerts than solving the underlying problems.
How Teams Investigate AI Agent Errors Today
When an AI agent throws an error today, someone gets pinged, opens Sentry or a log viewer, and reads through a raw stack trace to figure out what went wrong. A failed tool call? A context window that ran out mid task? An agent stuck looping on the same broken step? None of that is obvious from the trace alone, so the engineer reconstructs it by hand before starting on a fix.
Why Manual Error Analysis Doesn’t Scale
This works fine when errors are rare. It breaks down once agents handle real volume. The same failure types keep showing up, but nothing remembers having seen them before, so each gets a fresh diagnosis. Duplicate errors from the same bug flood the channel and bury the alert that actually matters.
Without a severity or confidence signal, everything looks equally urgent, which means nothing is, and teams either over-invest in manual triage or quietly tune out the noise, usually the moment they start looking for a lighter AI agent monitoring layer instead.
Common AI Agent Failure Patterns
Agent failures tend to fall into a small number of repeatable categories, even though most teams never name them explicitly.
- Tool call failure covers a request to an external API, database, or function failing outright.
- Context window exhaustion happens when the running conversation or tool history grows past what the model can hold, often after a long chain of tool calls with no summarization in between.
- State corruption shows up when the agent’s internal memory or task state ends up in a condition the logic never anticipated.
- Retry loop describes an agent stuck repeating the same failed step without progress.
Then there’s uncertain, the honest catch-all for errors that don’t cleanly fit anywhere else, and it matters as much as the other four, because guessing wrong costs more time than admitting you don’t know yet.
Start Automating AI Agent Error Triage Today
Skip the time-consuming setup. Download the complete workflow and start automatically classifying AI agent failures, assigning severity, and sending actionable alerts to Slack in minutes.
Get the Complete WorkflowHow This AI Agent Monitoring Workflow Works
This workflow automates the entire process of receiving, analyzing, and routing AI agent failures. Instead of relying on engineers to manually review every error, it classifies incidents, filters duplicate alerts, and delivers actionable insights directly to Slack. The result is a faster and more consistent incident response process that scales as AI applications grow.
What This n8n Workflow Does
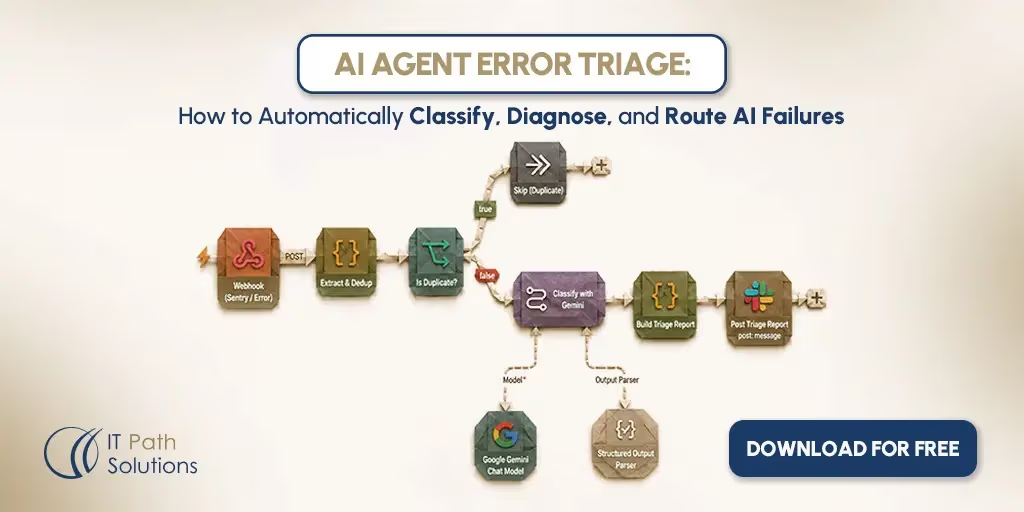
At a high level, the workflow takes a raw agent error and turns it into something a human can act on in seconds. It reads the incoming payload, checks whether it’s a duplicate of something already seen recently, and if not, sends it to an AI model for classification against the five categories above.
The model returns a confidence score, a severity rating, and a plain-language explanation of why it chose that category. From there, the workflow builds a triage report, attaches a matching fix playbook, and posts it to Slack, flagging anything it isn’t confident about instead of forcing a label that might be wrong.
That’s the core of what AI agent monitoring should look like: fast, honest, and specific enough to act on.
Step-by-Step Workflow Process
The workflow runs in a fixed order:
- a webhook receives the incoming error (native Sentry payload or generic message body),
- an Extract & Dedup step fingerprints it and checks a 30 minute in-memory window for duplicates,
- new errors move to AI classification and come back as structured JSON with category, confidence, and severity, and
- a Build Triage Report step maps that to a fix playbook and posts it through a Slack node.
It’s the same basic shape as most Sentry Slack integration setups, just with an AI classification and dedup layer in the middle.
Tools and Integrations Used
The workflow runs on self-hosted n8n, keeping the pipeline under your own control rather than a third-party SaaS.
- Slack authentication uses a bot token scoped to one channel, standard practice for any n8n Slack integration.
- Sentry is supported as an input source through its webhook format, though it’s optional, since any system that can POST a JSON body to the trigger URL works just as well, closer to a general-purpose n8n Sentry integration pattern than a Sentry-only tool.
- Classification runs on a Google Gemini model, and one honest caveat is worth flagging: confirm the exact model version against your live workflow before relying on it, since Gemini’s model availability and free tier limits shift often.
Turn AI Agent Errors Into Actionable Insights
This ready-made workflow automatically organizes, prioritizes, and routes AI agent failures, helping your team respond with confidence.
Automate AI Agent MonitoringHow the AI Agent Monitoring Workflow Automates Error Triage
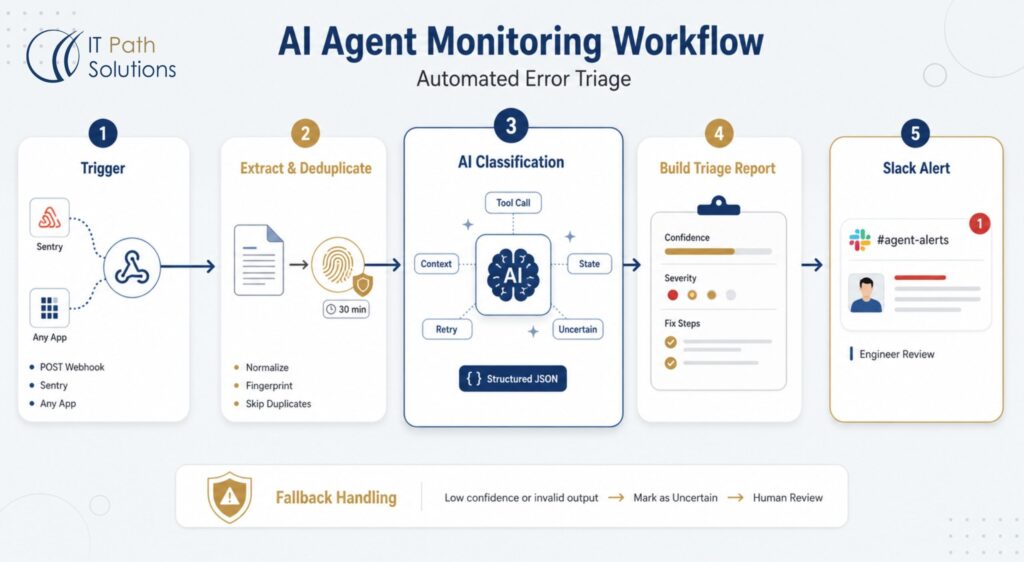
From the moment an AI agent reports an error to the final Slack notification, every stage of this workflow is designed to reduce manual investigation. It filters duplicate alerts, classifies failures with AI, and delivers structured triage reports so engineers can focus on resolving issues instead of interpreting raw logs.
Trigger
The entry point is a webhook listening on POST /agent-error-triage. It accepts two payload shapes: a native Sentry webhook, read directly with no transformation, or a plain body with a single message field for anything else. That flexibility matters, since plenty of teams interested in this workflow aren’t on Sentry at all. As long as something can POST error details, it can plug into this trigger.
Data Collection or Input
Once the webhook fires, an Extract & Dedup code node pulls the title, culprit, and stack trace out of whichever payload shape came in, normalizing both into the same structure. From that data it builds a non-cryptographic fingerprint, essentially a hash of the parts that identify it as the same underlying issue rather than a coincidentally similar one, and checks it against an in-memory store, using n8n’s workflow static data, over a 30 minute suppression window.
A match sets isDuplicate to true and routes to a Skip (Duplicate) no-op. No match means the error is new and continues to classification, which is what keeps the system from becoming the exact alert flood it’s meant to prevent.
AI Processing or Logic Layer
This is where classification happens. The error data goes into a Classify with Gemini node, a LangChain chain built around a fixed rubric covering the five categories: tool call failure, context window exhaustion, state corruption, retry loop, and uncertain.
- The prompt describes what each category typically looks like, then asks the model to pick one and explain why.
- A Structured Output Parser sub-node forces the response into valid JSON with fixed fields: category, confidence, severity, summary, and reasoning.
- Temperature is set low, around 0.1, to keep labeling consistent rather than getting a different call every time the same bug shows up.
It’s really AI log analysis against a fixed schema, reliable enough to route automatically.
Output, Notification, or Action
Once classification finishes, a Build Triage Report code node maps the category to one of four preset fix-playbook steps, then assembles a Slack message with everything an on-call engineer needs at a glance: confidence, severity, the original error and culprit, a summary, the model’s reasoning, suggested fix steps, and an optional link back to Sentry.
A Post Triage Report Slack node sends it to a dedicated #agent-alerts channel. Here’s roughly what a real report looks like for a context window exhaustion case:
🔴 Severity: High  |  Confidence: 92%
Category: Context Window Exhaustion

Error: agent.step() raised TokenLimitExceeded after 47 tool calls
Culprit: agents/research_agent.py:142

Summary: The agent's conversation history exceeded the model's
context window after a long chain of tool calls with no
summarization step in between.

Reasoning: Token count hit 132,890 against a 128k limit, inside
a loop that had already called the search tool 47 times without
pruning any earlier history.

Suggested Fix:
1. Add a history summarization step every 10-15 tool calls
2. Cap the maximum number of chained tool calls per task
3. Move to a model with a larger context window if the task
   genuinely needs the full history
4. Log token counts per step to catch this earlier next time

Open in Sentry →
That’s the whole shape of it: enough detail to act on immediately, no separate tab required.
Error Handling and Human Review
Not every error fits cleanly into one of the four named categories, and the workflow admits that rather than forcing a bad guess. Low confidence, or output that doesn’t parse as valid JSON, gets labeled uncertain with confidence set to zero, and it still posts to Slack for a human to review. That’s not a gap, it’s deliberate: a wrong category with false confidence wastes more time than an honest “not sure” ever would.
Give Your Team Faster, Smarter Incident Response
Instead of reading raw stack traces, let AI classify failures, suppress duplicate alerts, and provide recommended next steps. Import the workflow into n8n and start improving your incident response process today.
Download the Free WorkflowBusiness Benefits of This AI Agent Monitoring Workflow
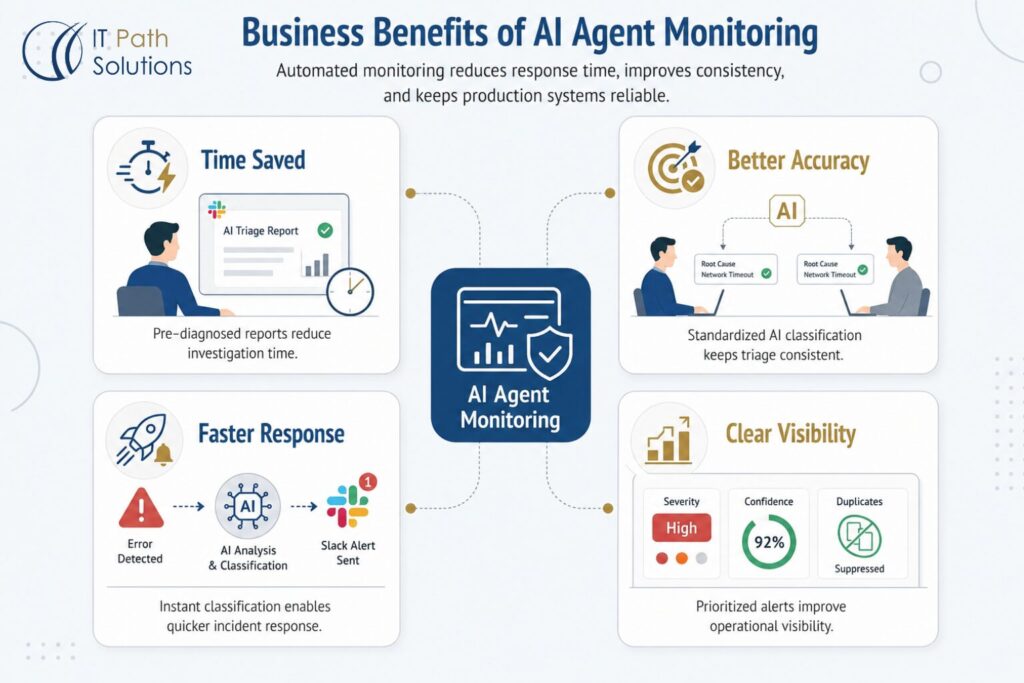
Automating AI agent monitoring is not just about reducing manual work. It helps engineering teams respond faster, stay consistent during incident triage, and keep production systems more reliable. These are the practical upsides most teams mean when they say they want AI agent monitoring: less time lost per incident, not more dashboards.
Time Saved
An engineer opens Slack and sees a pre-diagnosed report with a likely category, a confidence score, and a suggested fix already there, instead of starting from a raw stack trace. Minutes of reading turn into seconds of absorbing, which adds up fast across a week of on-call.
Better Accuracy or Consistency
Manual triage is inconsistent by nature. Two engineers looking at the same failure type on different days might categorize it differently, especially at 2am under pressure. A fixed low temperature removes most of that variance, so the same failure gets labeled the same way regardless of who’s on call.
Faster Response or Execution
The workflow runs continuously, so triage happens the moment an error arrives rather than whenever an engineer notices it. For teams without 24/7 coverage, that gap can stretch for hours. Automated classification closes it immediately, and the diagnostic work is already done by the time a human sees the alert.
Easier Reporting and Visibility
Every report carries a severity rating and a confidence score, so anyone scanning the channel can tell at a glance what needs attention and what can wait. When everything looks equally urgent, teams start ignoring all of it. Combined with dedup suppressing repeat noise, the signal stays clear enough that engineers keep reading the channel instead of muting it.
A Better Way to Handle AI Agent Failures
Move beyond raw stack traces and manual investigation. Use AI to categorize recurring failures and create a more efficient incident response process.
Try the WorkflowHow You Can Customize This Workflow
Every team’s AI stack and incident management process is different. This workflow is designed to be flexible, making it easy to replace services, adjust business logic, or extend the automation as your monitoring requirements evolve.
Tools You Can Swap or Add
Gemini isn’t a hard requirement. Swapping providers mainly means updating the credential and model node, since the structured output parser doesn’t care which model produced the JSON, as long as it’s valid.
Sentry is one convenient error source, not the only one. Any system that can send a webhook payload, a custom logging pipeline, a different tracker, an internal monitoring tool, can be wired in alongside or instead of it.
Business Rules You Can Modify
Two settings are easiest to tune. The dedup window is currently 30 minutes, adjustable depending on how often the same issue tends to resurface in your logs.
The confidence threshold for the uncertain fallback is also adjustable: lower it to accept more borderline classifications, or raise it to stay conservative.
Approval Steps You Can Include
Worth being upfront about: there’s no human approval gate today. Everything posts to Slack automatically once classification finishes. Adding one is a reasonable extension for teams with stricter change management needs, particularly before high severity classifications trigger downstream automation, but it’s a suggested addition, not a built-in feature today.
Reporting or Analytics You Can Add
Right now every triage report lives in Slack and nowhere else, fine for visibility but not for long-term tracking. A natural next step, on the roadmap, is pushing reports into an incident tracker like Jira or Linear alongside Slack, opening the door to trend reporting, like which failure category shows up most in a given month.
Limitations and Things to Watch Out For
No AI agent monitoring setup is complete without being upfront about where it falls short.
API Limits and Tool Restrictions
Gemini’s free tier has rate limits that vary by model and can change based on provider policy, so confirm current limits before relying on this for real volume. Teams running a handful of agents in early production will likely stay within free tier limits. Heavier traffic, or a rocky rollout with frequent errors, should plan to move to a paid tier, since hitting a rate limit mid-triage means classification requests start failing.
Data Quality and Prompt Accuracy
Classification quality depends entirely on how much useful detail is in the error being classified: a straightforward garbage in, garbage out situation. A stack trace with a real culprit and a clear exception type gives the model something solid to reason about. A log entry that just says Exception: failed gives it nothing, and the workflow will correctly label that uncertain rather than invent a category it can’t support. If your agents log sparse error messages today, improving that logging matters more than any tuning on the classification side.
Security, Permissions, and Compliance
The Slack bot token needs narrow scoping, limited to the specific channel this workflow uses rather than broad workspace access it doesn’t need. Credentials, the Slack token and the Gemini API key, should live in n8n’s credential system rather than hardcoded in the workflow JSON, since that JSON is what you’d hand off or check into version control.
Download the n8n Workflow JSON
What Will You Get in this Workflow
The download includes the full importable workflow JSON, ready to drop into any n8n instance. It doesn’t include credentials of any kind, since those need setting up individually in your own environment.
A complete handover for a production rollout would also typically include a short test script and a credentials checklist, worth putting together yourself or requesting if you’re getting help with setup.
Spend Less Time Debugging, More Time Building
Manual error investigation slows every engineering team down. This workflow helps classify failures, prioritize incidents, and send clear Slack reports automatically.
Start Automating TodayHow to Use the Template
Import the JSON into your n8n instance, then set up your Gemini credential in the Classify with Gemini node. Open the Post Triage Report node and set the correct Slack channel ID, commonly something like #agent-alerts.
Once both credentials are set, activate the workflow to expose the production webhook URL you’ll point Sentry or your error source at, then send a test error through it to confirm the whole chain works end to end.
Need This Customized for Your Business?
The template covers the core loop well, but there’s a point most teams outgrow it: scaling past free tier rate limits, needing an approval step before high severity issues escalate, wanting reports pushed into an incident tracker instead of just Slack, or running a proprietary agent framework that doesn’t map onto the assumptions built into this version. None of that is a flaw in the base workflow, just the next layer once agent volume and team process mature past what a starter template handles.
Build on a Ready-Made Foundation
Why start from scratch when you can begin with a proven workflow? Download the template, customize it for your environment, and adapt it to your AI agents, monitoring tools, and internal processes.
Download the Automation WorkflowHow IT Path Solutions Can Help You Deploy It Properly
If you need the workflow to do more than the default template, IT Path Solutions can help customize it around your business requirements. Through our agentic AI development services, we help organizations design and extend AI-powered workflows that integrate with the tools, platforms, and processes they already use.
Whether you need to connect additional monitoring systems, build custom integrations, introduce approval workflows, fine-tune AI classification logic, automate incident routing, or extend reporting with platforms like Jira, Linear, or your own internal applications, our team can adapt the workflow to match your operational needs. We can also customize it to work with proprietary AI agents, in-house applications, and business-specific workflows that go beyond the capabilities of the standard template.
The goal is not just to automate AI agent monitoring, but to create a workflow that fits naturally into the way your teams operate and continues to support your business as your AI initiatives grow.
If you’re planning to tailor this workflow for your organization or have a specific use case in mind, feel free to contact our team at. We’d be happy to discuss your requirements and help you build a solution that works for your business.
The Takeaway
Agent errors aren’t going away, and reading raw stack traces by hand doesn’t scale past a certain point no matter how good your team is at it. This workflow reads an error, names what kind of failure it actually is, attaches a fix playbook, and tells you honestly when it isn’t sure instead of dressing up a guess as an answer.
That’s the practical core of AI agent monitoring done well: not a dashboard full of metrics nobody checks, but a system that turns a 2am stack trace into something you can act on in seconds. The workflow JSON above gets you running today.
If your setup needs more, from incident tracker integration to a proper approval gate, that’s worth a conversation before you build it yourself.
Automate More Business Processes with n8n
Once you’ve automated AI agent monitoring, there are plenty of other repetitive processes worth eliminating. Explore workflows that help generate SEO content, capture leads, document meetings, distribute content, manage freelancer finances, and create LinkedIn posts with AI.
- n8n SEO Automation Workflow
- AI Meeting Notes Automation
- Reddit Lead Generation Workflow
- Automated Content Distribution Pipeline
- Freelancer Budget Tracking Workflow
- AI LinkedIn Post Automation
Frequently Asked Questions
1. Can this workflow work with AI frameworks other than LangChain?
Yes. Although the examples in this workflow use LangChain, it can also work with CrewAI, AutoGen, OpenAI Agents SDK, or proprietary AI agent frameworks. As long as your application can send error details through a webhook, the workflow can classify and route those incidents. If your environment requires custom integrations or proprietary workflows, IT Path Solutions can tailor the automation to fit your existing AI infrastructure.
2. What happens if the AI model isn’t confident about the error category?
Instead of forcing an incorrect classification, the workflow marks the incident as Uncertain and still sends it to Slack for manual review. This helps reduce false confidence while ensuring engineers can investigate ambiguous errors without losing visibility.
3. Can IT Path Solutions build a custom AI agent monitoring solution for our business?
Yes. If your requirements extend beyond the downloadable workflow, IT Path Solutions can design and develop a customized AI agent monitoring solution that fits your infrastructure and business processes. This can include custom AI integrations, incident routing, approval workflows, proprietary agent support, reporting dashboards, and end-to-end workflow automation tailored to your organization.
4. Can this workflow be extended beyond AI agent error monitoring?
Yes. The same workflow pattern can be adapted for many AI operations use cases, including application monitoring, automated incident response, log classification, support ticket routing, and AI-powered operational workflows. If you have a different automation requirement, IT Path Solutions can help design a workflow that fits your specific business needs.

Keyur Patel
Co-Founder
Keyur Patel is the director at IT Path Solutions, where he helps businesses develop scalable applications. With his extensive experience and visionary approach, he leads the team to create futuristic solutions. Keyur Patel has exceptional leadership skills and technical expertise in Node.js, .Net, React.js, AI/ML, and PHP frameworks. His dedication to driving digital transformation makes him an invaluable asset to the company.
Related Blog Posts
How to Build n8n AI Chat Agent with RAG, Gemini & Qdrant
How to Automate Meeting Notes and Action Item Distribution with AI