
DevExpress Web Reporting: A Complete Guide to Browser-Based Reporting
Keyur Patel
May 20, 2026
13 min
Last Modified:
May 20, 2026
Adding reporting to a web application sounds straightforward until you are actually doing it. You start with “we just need a PDF export” and six weeks later you are still buried in pagination logic, struggling with Excel formatting, and wondering why the print layout breaks on certain data. Every team that has gone down this path knows how quickly “simple reporting” becomes its own side project.
According to a 2025 global analytics survey, 84% of executives say business intelligence and analytics are critical to their digital transformation strategy, while organizations with mature analytics capabilities report significantly faster decision-making and higher operational efficiency.
DevExpress Web Reporting exists to solve exactly this. Rather than building the pieces yourself, you get a ready-made reporting pipeline. It includes a browser-based report designer, an interactive document viewer, and built-in export to multiple formats. The infrastructure is already there. You wire it up and ship.
This guide covers what DevExpress Web Reporting actually is, how it sits within your existing tech stack, what its core components do, and whether it makes sense for your specific situation.
What DevExpress Reporting Actually Is
Most people assume reporting tools are either a PDF library or a chart widget. DevExpress Reporting is neither. It is a complete reporting system that handles the entire workflow from start to finish.
The process works like this. You design a report layout visually and connect it to a data source. The server then renders it into a paginated document. That document is delivered to the browser, where users can interact with it. They can search through it, filter it, drill into grouped sections, and export it in whatever format they need. No desktop software, no browser plugins, and nothing to install on the user’s machine.
This is the fundamental difference from older reporting tools. Traditional reporting often meant installing software on every machine, relying on IT to run batch jobs, or building separate export pipelines for different formats. With DevExpress Web Reporting, the entire experience lives in the browser, and the heavy lifting happens server-side.
Here is a quick comparison:
| Traditional Reporting | DevExpress Web Reporting | |
|---|---|---|
| Access | Desktop client or server install | Any browser, nothing to install |
| Report Design | Developer-only | Browser-based, business users can do it too |
| Rendering | Local machine or batch process | Server-rendered, consistent output every time |
| Export | Usually a separate step requiring extra work | Built in: PDF, Excel, Word, CSV, HTML |
| Integration | Tightly tied to one specific stack | REST API-based, works with most backends |
Why Development Teams Choose It
The honest answer is time. Building reporting functionality from scratch takes weeks, sometimes months, if you factor in edge cases around pagination, font rendering, print layouts, and export formatting. DevExpress compresses that timeline significantly.
But speed of delivery is not the only reason it gets picked.
- Enterprise solution users can operate the report designer themselves.
The report designer runs in the browser and uses drag-and-drop. Someone in finance or operations can adjust a layout, move a column, or change a grouping without raising a ticket with the development team. For teams where reporting changes are frequent, this alone saves a meaningful amount of back-and-forth.
- It connects to whatever data you are already using.
SQL databases, REST APIs, flat files, and in-memory data objects. DevExpress supports them all. You are not forced to restructure how your data works to fit the tool.
- Export is built in, not bolted on.
PDF, Excel (XLSX), Word (DOCX), CSV, HTML. Users get these formats from a single button click. Core export functionality is built in and works with minimal setup, though production deployments often require tuning for fonts, memory usage, storage, and large-document performance.
How It Fits Into Your Tech Stack
DevExpress Reporting was built with .NET at its core, but its architecture is designed so it does not have to live in a pure .NET environment.
1. If Your Backend Is .NET
This is the native home for DevExpress Reporting and the path with the least friction. It supports the current long-term support versions of .NET and integrates directly with:
- ASP.NET Core: the primary setup, handling report rendering and API endpoints
- MVC and Razor Pages: straightforward integration with existing ASP.NET applications
- Blazor (both Server and WebAssembly): first-party components, no workarounds needed
2. On the Frontend
The browser-side components are JavaScript widgets that do not have an opinion about which frontend framework you use. Whether your team is building with Angular, React, or Vue, or just plain HTML and JavaScript, you can embed the report designer or document viewer and connect it to a backend endpoint.
3. If You Are Not on .NET
Teams running Node.js, Python, Java, or PHP can still use DevExpress Web Reporting. The typical approach is to run a small, dedicated ASP.NET Core service specifically for reporting. This service stays separate from your main application. Your frontend connects to it for the viewer, and your backend calls it when it needs to generate a PDF or export file programmatically.
This keeps the reporting concern isolated. Your main application does not need to touch .NET at all, and the reporting service stays clean and focused.
A practical note for mixed-stack teams: Many teams containerize this reporting service using Docker and run it alongside the rest of their applications. The frontend talks to it directly for interactive viewing. The backend calls it when a PDF needs to be generated on demand. It is a clean separation that does not require touching the main codebase.
How it all works in plain terms: The server loads the report layout, pulls in the relevant data, and renders the pages. Those rendered pages are sent to the browser, which handles everything the user interacts with, including page navigation, text search, parameter selection, and export.
Need Help Integrating Reporting Into Your Existing Stack?
You do not need to rebuild your application around .NET to use DevExpress Reporting effectively. Many teams run reporting as a dedicated service alongside Node.js, Python, PHP, or Java-based applications.
Whether you need architecture consulting, reporting automation, or want to hire .NET developers to build scalable reporting solutions, we help businesses design and implement custom reporting systems that integrate cleanly with existing applications. From isolated reporting microservices to scalable export workflows and multi-tenant reporting systems, our team can help you get production-ready faster.
Looking for the right guidance? We are right here at your service; feel free to contact us.
The Web Report Designer
The designer is where reports are created. It runs entirely in the browser. No desktop application, no IDE required. Users can drag and drop elements onto a canvas: data tables, text labels, charts, barcodes, images, and more.
Report layouts are saved as .repx files, which are XML under the hood. This matters for development teams because .repx files can be stored in version control alongside the rest of the codebase. They can be tracked for changes and rolled back if needed.
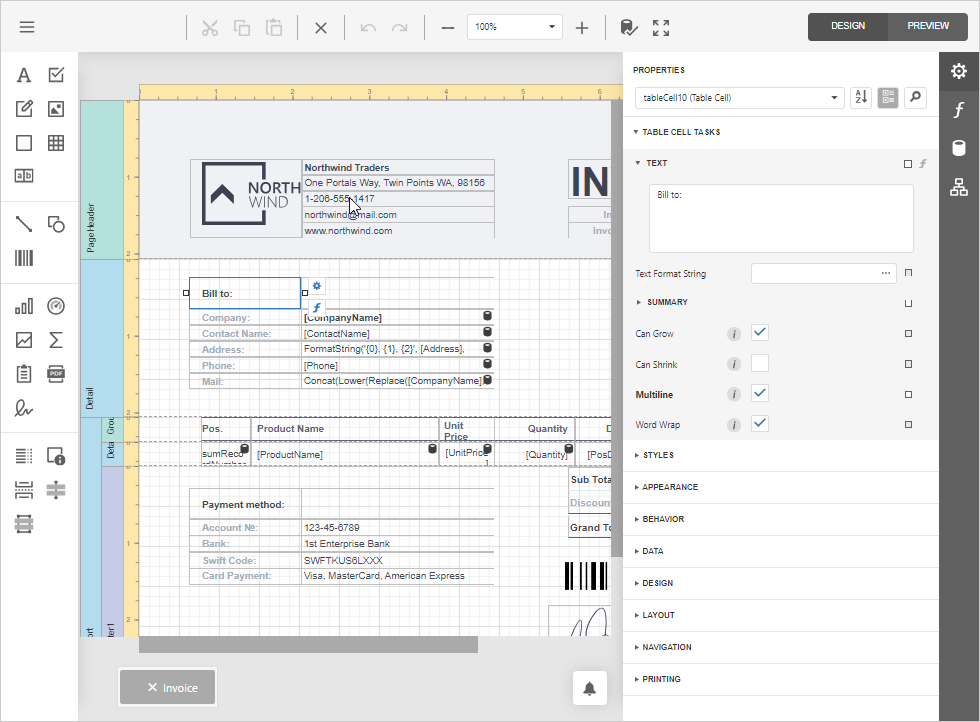
The designer includes a data source connection wizard so you can point it at your database or API without writing custom binding code. It also has an expression editor with autocomplete for creating calculated fields and conditional formatting. A live preview mode shows exactly what the finished report looks like before it is published.
One useful capability for product teams is that you can expose the designer to end users with defined boundaries. Customers or internal staff can customize their own reports within limits you set, without any access to the underlying code or the ability to break the core template.
The Report Viewer
Once a report is built, users view it through the Document Viewer. It renders high-fidelity paginated output directly in the browser. Users do not need to download anything just to read a report.
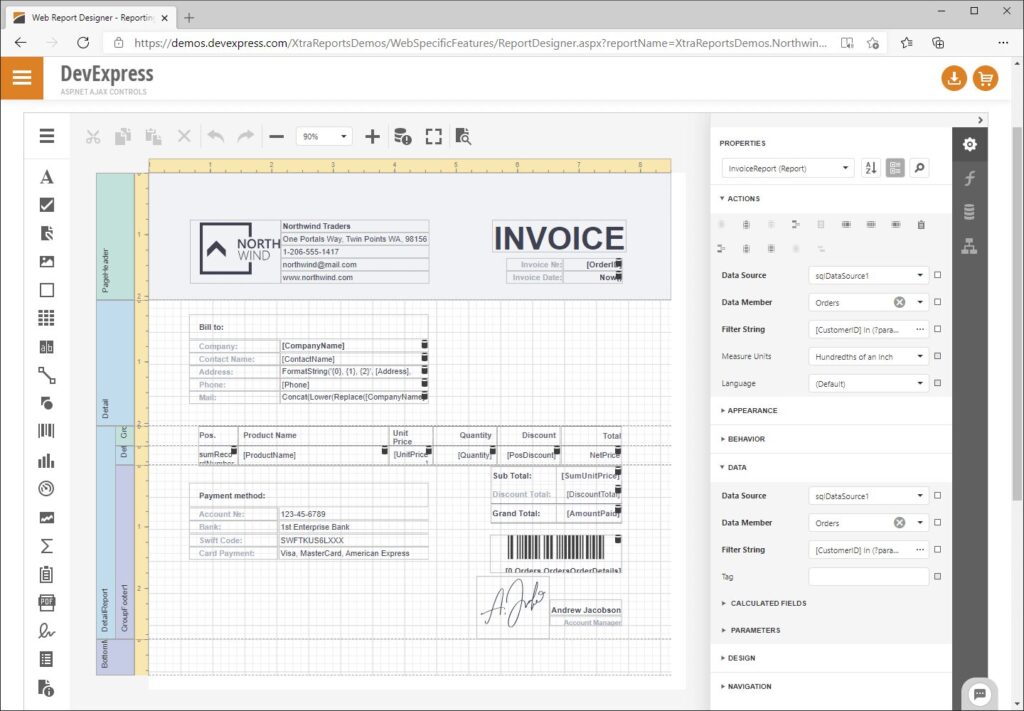
What separates it from a static document viewer is the interactive layer:
- Drill-down: Users can click on grouped sections to expand or collapse them. They can dig into detail when they need it and collapse it when they do not.
- Parameter panel: Before a report renders, users can set parameters such as a date range, a region, or a product category. The report runs against those inputs rather than always returning the full dataset.
- In-browser search: Text search works across the entire paginated document without needing another server request.
- Column sorting: Users can interactively sort data within many report scenarios, though some operations may trigger additional server-side processing depending on report complexity.
Export Formats
Export is where a lot of reporting tools fall short. They handle PDFs reasonably well but produce broken Excel files or lose formatting in Word. DevExpress covers all the common formats and handles them properly:
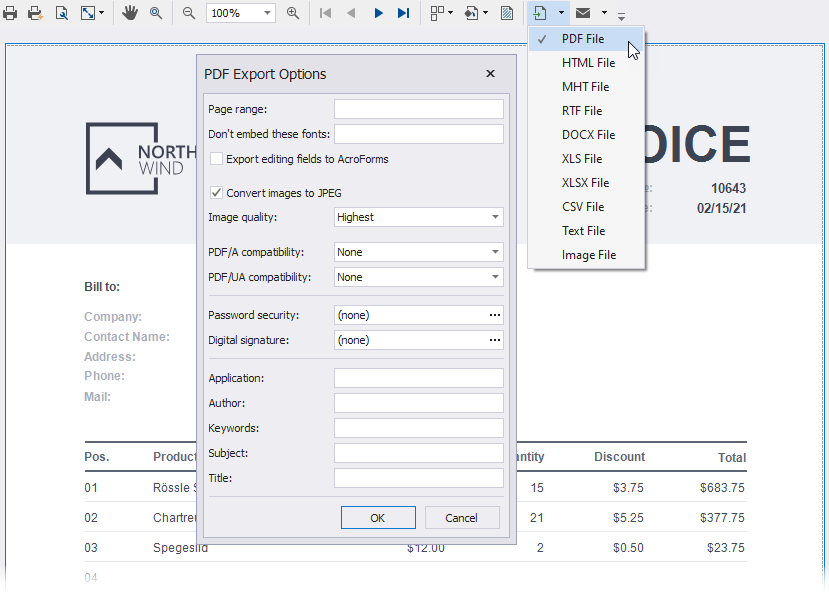
- PDF – print-ready, pixel-accurate, universally compatible
- XLSX – data and formatting both come through correctly in Excel
- DOCX – produces an editable Word document, useful when someone needs to add annotations or modify the content after exporting
- CSV – clean raw data for downstream processing, data pipelines, or feeding into other systems
- HTML – can be embedded in web pages or sent in email bodies
- PNG / JPEG / TIFF – image snapshots of report pages, useful for thumbnails or embedding in presentations
All of these are available from a single export panel in the viewer. No extra setup is required.
Data Sources It Supports
- SQL Databases
The most common setup. DevExpress works with SQL Server, PostgreSQL, and MySQL through direct SQL queries, stored procedures, or Entity Framework, which is a popular .NET data access layer. You write your query, map the columns to your report fields, and you are done.
- REST APIs and JSON
You can point the data source wizard at an API endpoint. It reads the JSON response and lets you map fields to report elements. This is particularly useful in microservice architectures where data lives behind APIs rather than directly accessible databases.
- In-Memory Object Models
If you are working code-first, where your data is already loaded into application objects, you can pass those objects directly as the report’s data source. No database query is needed. This is clean to test and works well in situations where the data is assembled programmatically before the report runs.
- Files (Excel, XML, CSV)
For teams in operations or finance where users upload a spreadsheet and expect a formatted report back, DevExpress can use file-based inputs directly as data sources.
Where It Gets Used in Practice
- SaaS products with per-customer reporting
When your product serves multiple customers and each one wants reports on their own data, building a custom export feature for every request is not sustainable. Embedding the designer with per-tenant access controls lets customers build and customize their own reports within the platform. You ship the capability once, not repeatedly.
- Finance and accounting systems
Profit and loss statements, expense reports, audit logs. These need multi-level grouping, subtotals, proper currency formatting, and consistent output. DevExpress handles the formatting complexity. Because a report definition always produces the same output, the results are auditable and reproducible.
- Internal operations and admin tools
HR teams, logistics teams, and operations staff often rely heavily on reports. Giving them self-serve access to a report viewer embedded in the internal admin panel removes the constant stream of “can you pull this data for me” requests from the development team’s queue.
- Regulated industries
Healthcare, finance, and legal environments have compliance requirements around documentation. The .repx file serves as the defined template. The same template always produces the same output. That predictability and traceability matter for compliance submissions and audit trails.
Practical Considerations Before You Deploy
A few things worth knowing before you go live, based on how teams commonly run into trouble:
- Filter data at the source, not inside the report engine.
If your query returns 100,000 rows and you filter them inside the report, you are loading all of that into memory first. Push filters down to the SQL query or the API call so only the needed data ever reaches the report.
- Cache reports that do not change between requests.
A monthly summary or a static template does not need to be regenerated every time someone views it. Serving a cached version saves server resources and speeds up load time for the user.
- Store report definition files in a database rather than on the server’s file system.
This is especially important for multi-tenant products. It makes it straightforward to associate each report with the right tenant and manage them centrally.
- Build one parameterized template instead of multiple hardcoded ones.
If you have reports for five different regions, you do not need five separate report files. One report with a Region parameter does the same job and is far easier to maintain.
- Put your
.repxfiles in version control.
They are XML files. They track changes cleanly in Git. Treating them like code means you have a full history of every change. You can review them the same way you would review any other change and roll back if something breaks.
Is DevExpress Web Reporting the Right Choice?
It depends on what you are building.
DevExpress Web Reporting is well-suited when your application needs real reporting and not just a data grid or a simple table download. If users need to interact with their data, filter it by different criteria, drill into grouped summaries, and export the results in multiple formats, this is a mature and capable tool that will save your team significant development time.
It is probably more than you need if your entire reporting requirement is generating two or three static PDFs. A lighter library is a better fit for that situation. It is simpler to set up, has less overhead, and costs less.
This is likely a good fit if:
- You need a visual report designer that non-developers can use
- Your reports require drill-down, parameter filtering, or column sorting
- You need reliable export to PDF, Excel, and Word from a single report definition
- Your backend is .NET, or you are willing to run a small .NET service alongside your main application
- Multiple customers or teams need access to their own data in report form
DevExpress Reporting is a commercial product licensed as part of the broader DevExpress suite, so teams should evaluate licensing costs alongside the development time savings and feature set. The fastest way to evaluate it is to connect your own data source and see how long it takes to produce a working report. That answer tells you more than any feature list.
Final Thoughts
Reporting tends to become more complicated than expected once requirements start growing. Export formats, pagination, filtering, print layouts, and interactive viewing all add development overhead that teams often underestimate.
DevExpress Web Reporting helps reduce that complexity by providing a complete reporting framework with a browser-based designer, interactive document viewer, and built-in export support for formats like PDF, Excel, Word, and CSV. It fits naturally into .NET applications and can also work alongside other technology stacks through a dedicated reporting service.
For teams that only need a few static exports, a lightweight document library may be enough. But if your application requires interactive, user-driven reporting with flexible export options, DevExpress is a mature and practical solution worth considering.
The best way to evaluate it is with your own data and real-world reporting requirements. The free trial makes it easy to test how quickly you can move from setup to a working report. And if you need help designing or integrating a scalable reporting solution, IT Path Solutions can help you get there faster.

Keyur Patel
Co-Founder
Keyur Patel is the director at IT Path Solutions, where he helps businesses develop scalable applications. With his extensive experience and visionary approach, he leads the team to create futuristic solutions. Keyur Patel has exceptional leadership skills and technical expertise in Node.js, .Net, React.js, AI/ML, and PHP frameworks. His dedication to driving digital transformation makes him an invaluable asset to the company.
Related Blog Posts

Build an App Like TaskRabbit With AI (2026): Cost, Features & Top Alternatives

How Much Does It Cost to Build an App Like Life360 in 2026? (+ How AI Can Cut That Cost in Half)